WhatsApp Analytics & Reporting
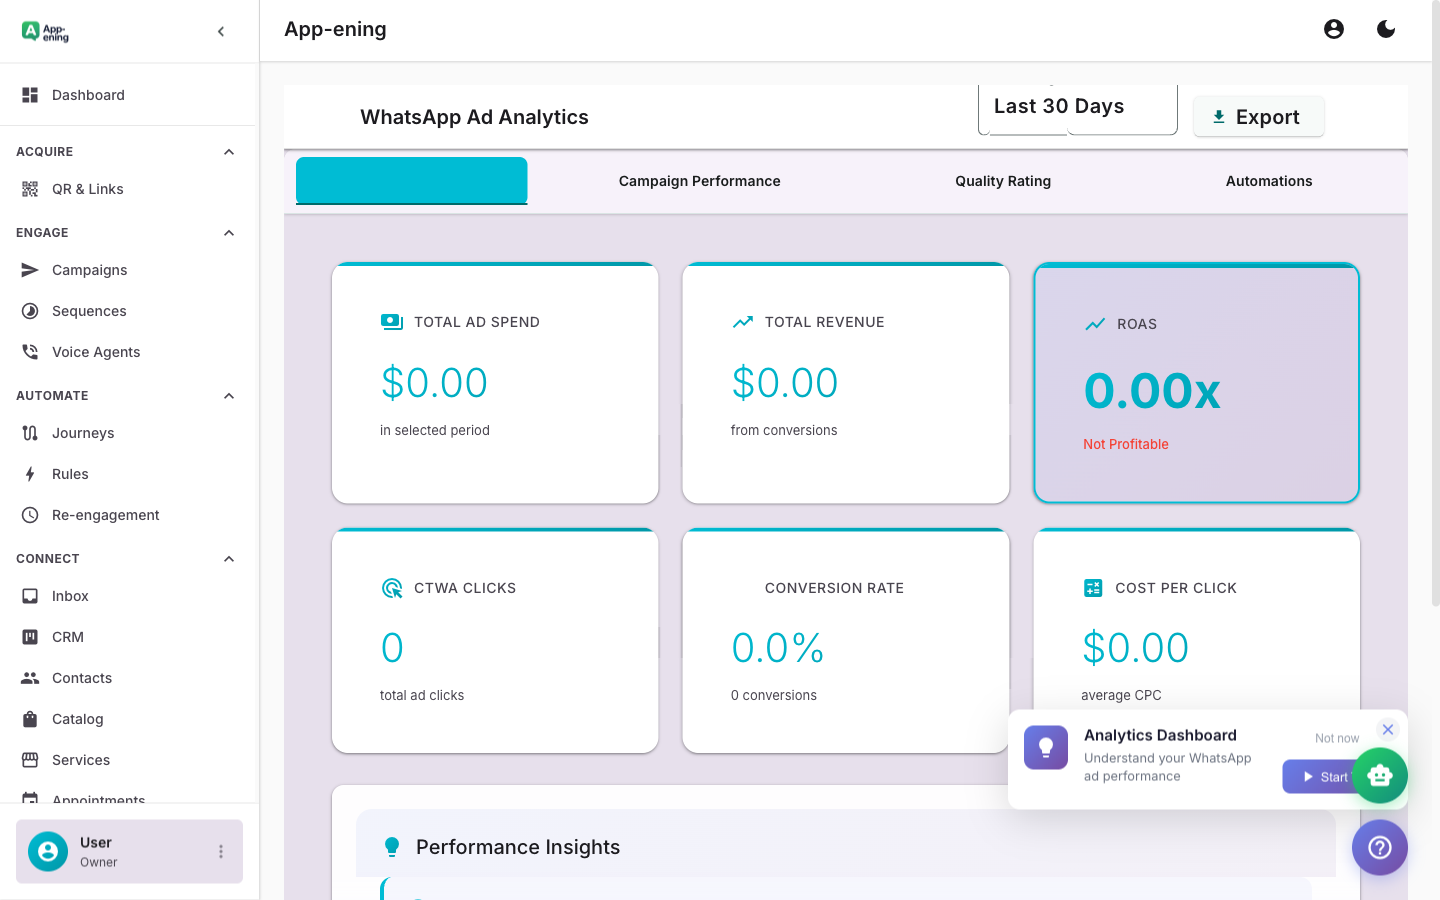
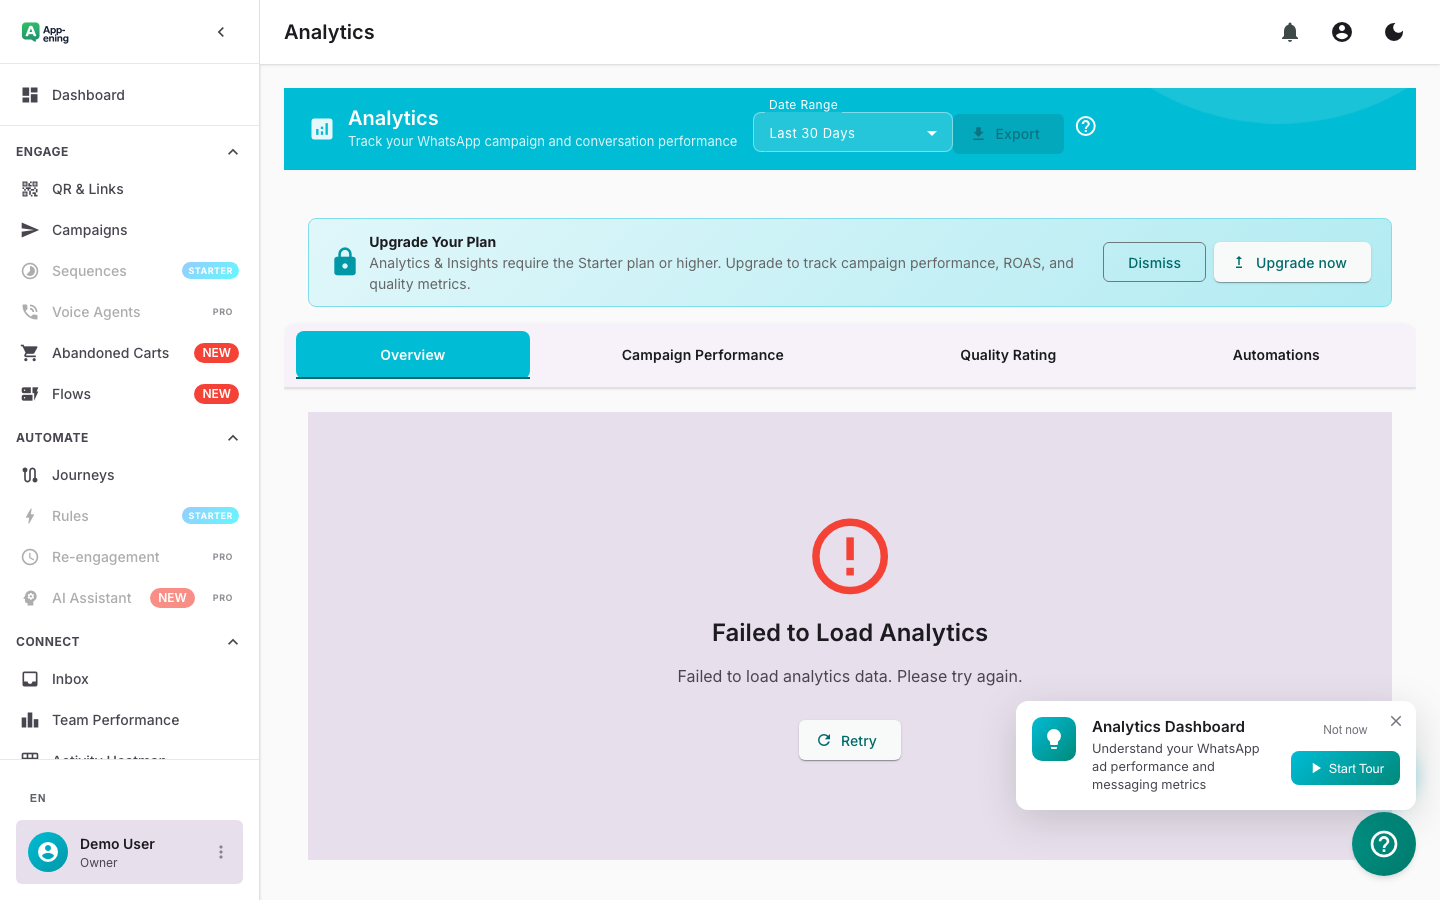
Track WhatsApp campaign performance with real-time analytics. Monitor delivery rates, read receipts, CTWA ad ROAS, and contact growth with exportable reports.
Get StartedTrack WhatsApp campaign performance with real-time analytics. Monitor delivery rates, read receipts, CTWA ad ROAS, and contact growth with exportable reports.
Get StartedTrack sent, delivered, read, and replied metrics for every message and campaign.
Monitor response times, resolution rates, and customer satisfaction scores per agent.
Measure revenue attributed to campaigns with conversion tracking and cost analysis.
Understand peak hours, popular topics, and sentiment trends across all conversations.
Build tailored reports with date ranges, filters, and exportable CSV/PDF formats.
Live overview of active conversations, queue depth, and team availability at a glance.
See key metrics at a glance — conversations handled, response times, campaigns sent, and revenue generated through WhatsApp.
Drill into each campaign with delivery rates, open rates, reply rates, and click-through tracking on CTA buttons.
Track per-agent metrics: conversations handled, average response time, resolution rate, and CSAT scores.
Set up Analytics in your App-ening dashboard. Customise settings to match your workflow.
Turn on the feature and connect it with your existing tools and India business processes.
See results from day one with automated WhatsApp workflows that save time and grow revenue.
Monitor delivery rates, read rates, and click-through rates across every campaign you send. See which message templates get the highest engagement, which send times produce the best open rates, and which audience segments convert at the highest rate. A coaching institute running weekly class reminders can compare Tuesday vs Thursday sends and discover that Thursday 6 PM messages get 34% more confirmations -- then adjust all future campaigns accordingly. Filter by date range, template, or segment to pinpoint exactly what is working and what needs to change.
Connect your Facebook and Instagram click-to-WhatsApp ad spend to actual WhatsApp conversations and downstream revenue. Most businesses running CTWA ads have no idea which ad creative or audience is generating real conversations versus wasted clicks. App-ening's analytics track the full funnel: ad click, WhatsApp conversation opened, agent assigned, CRM stage progression, and final conversion. A real estate developer spending $2,000/month on CTWA ads can see that their "3BHK ready to move" creative generates 4x more qualified leads than their "luxury living" creative -- at half the cost per conversation.
Track response times, resolution rates, and conversation volume per team member with concrete numbers instead of guesswork. See which agents respond within 2 minutes and which average 15 minutes. Identify agents handling 40 conversations per day versus those handling 15. Use first-response time, average handle time, and customer satisfaction scores to run fair, data-driven performance reviews. A home services company with 8 support agents can identify that their top performer closes 72% of complaints in under 10 minutes -- then use that benchmark to train the rest of the team.
Analyse conversation volume trends by hour, day of week, and month to forecast staffing needs during peak periods. Spot seasonal patterns -- a tax consultancy might see 3x volume in January and March -- and plan team schedules accordingly. Identify that Mondays between 10 AM and 12 PM are your busiest window, then ensure you have enough agents online during those hours to keep response times under your SLA target.
Free: Basic message stats. Starter: Campaign analytics. Pro: Team performance + ROAS. Business: Custom reports and exports.
Start your 180-day money-back guarantee. Set up in minutes.
Get Started